Morena team,
So we ran into some confusion around linear equations. Lets go back
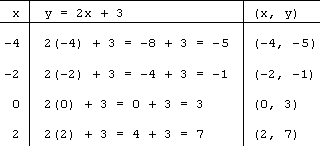
we are going to graph this equation
y= 2x +3
Step 1. Create a three columned table like the one below.
Step 2. Start by picking your x values. In the table below you can see that the person has picked -4 all the way to 2.
Step 3. Work out what the y= by placing each of the x values into the equation. eg.
y=2x + 3
so
y= 2 times -4 and then add three. Remember in bedmas we do the multiplication first, then the addition.

Do this for each of your x terms which you can put in your third column, which will have the coordinates for you to graph.
Lets try doing it with the equation
y= 3x +1
Remember to use the steps above.
NEXT: actually graph those points. Remember, its always going to be a straight line.
Once you have created a table like the one above with each of your terms, read through this great tutorial on graphing the points, although you guys seem pretty capable at graphing coordinates. Click here.

No comments:
Post a Comment